Author: Paj Johnstone | Posted On: 20 Nov 2024
Over the past four years, we have tracked a series of key economic indicators in the Fifth Quadrant Economic Playbook, offering a comprehensive view of trends across the real estate, construction, automotive, and retail sectors.
Given the ongoing discussions around the housing and rental markets, now is an ideal time to examine the real estate data and analyse the trends that have emerged since the pandemic.
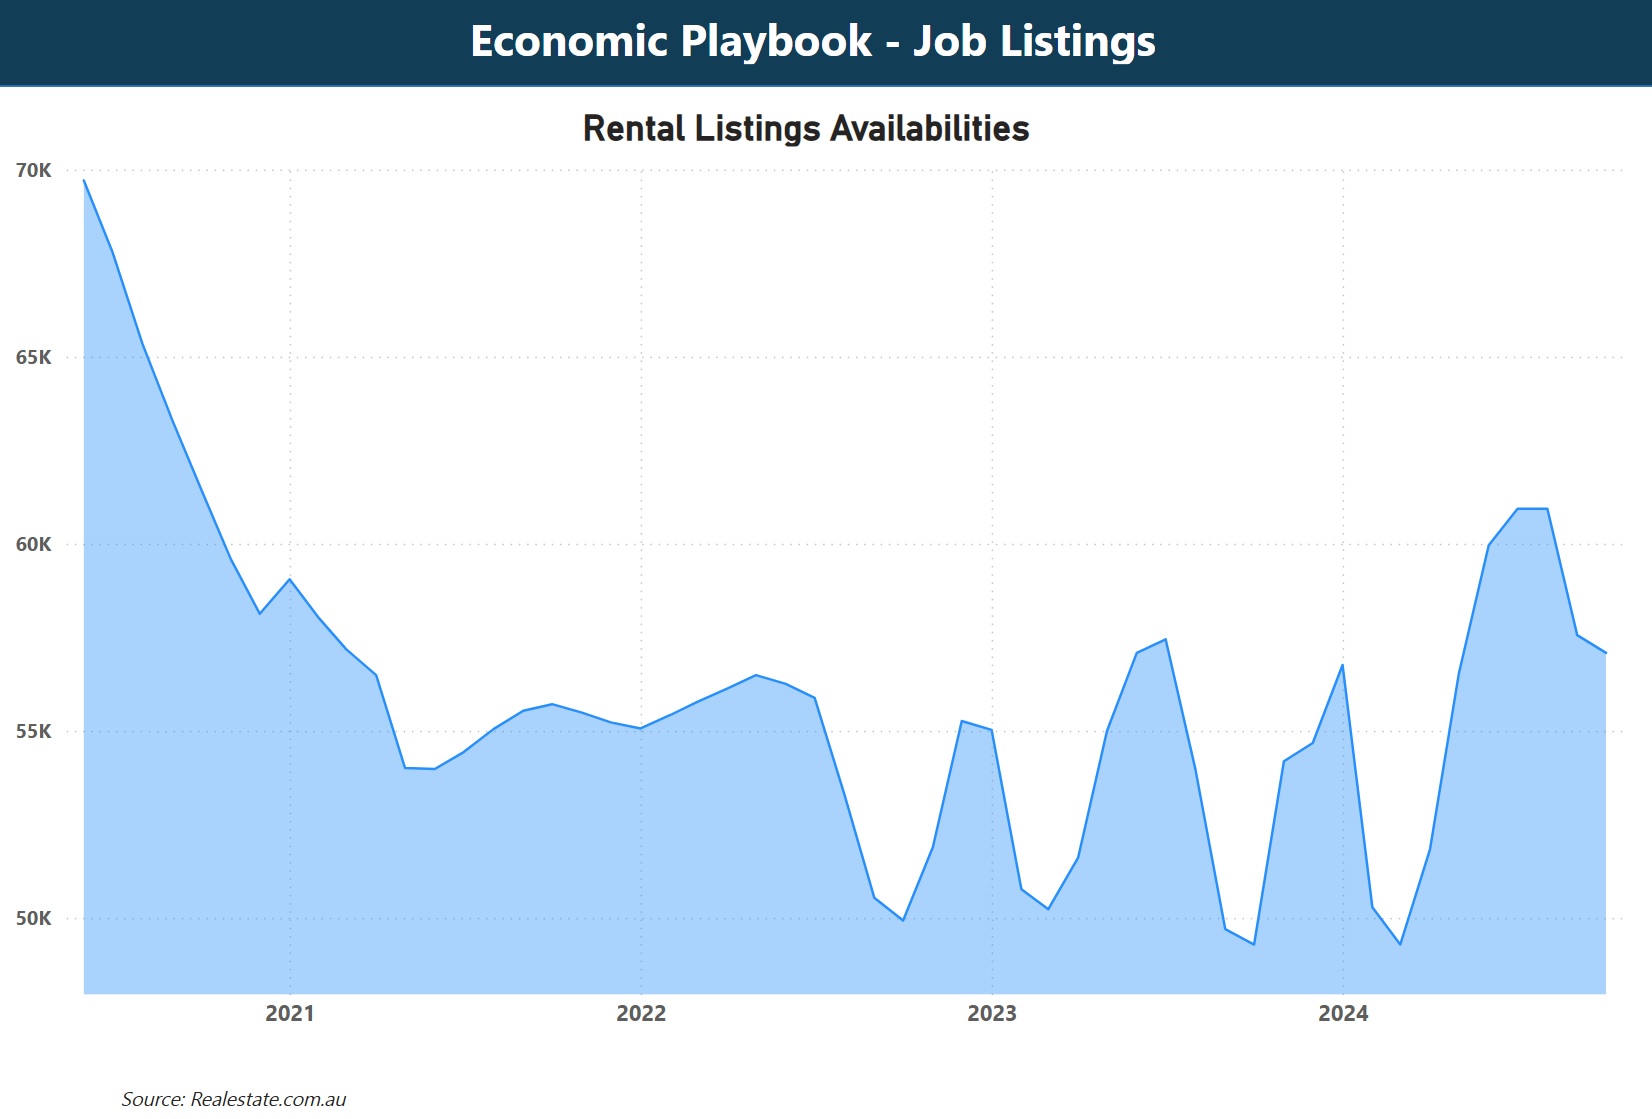
rental listings
Since June 2020, rental listings in Australia have dropped by 21% (down from 70,000 to 57,000 listings), with populous states like Victoria and New South Wales seeing the largest declines driven by factors such as increased demand, migration, affordability pressures, and limited new housing supply. Victoria alone recorded a 34% drop.
Post-pandemic, many people have returned to cities, preferring urban living for work and lifestyle opportunities, which has intensified demand in major metropolitan areas. Population growth, especially through resumed immigration, has further squeezed the rental market in these states, where most new arrivals seek accommodation.
Rising housing prices have also made homeownership less accessible, keeping more people in rentals longer. Additionally, construction slowdowns due to supply chain and labor issues have limited the addition of new properties. Investor behavior is also shifting with some properties moving to the short-term rental market, reducing available long-term rentals.
The convergence of these factors is reshaping the rental market, making competition fiercer and affordability a challenge. As a result, renters face a more competitive landscape, while the need for solutions to balance demand and supply becomes more pressing.

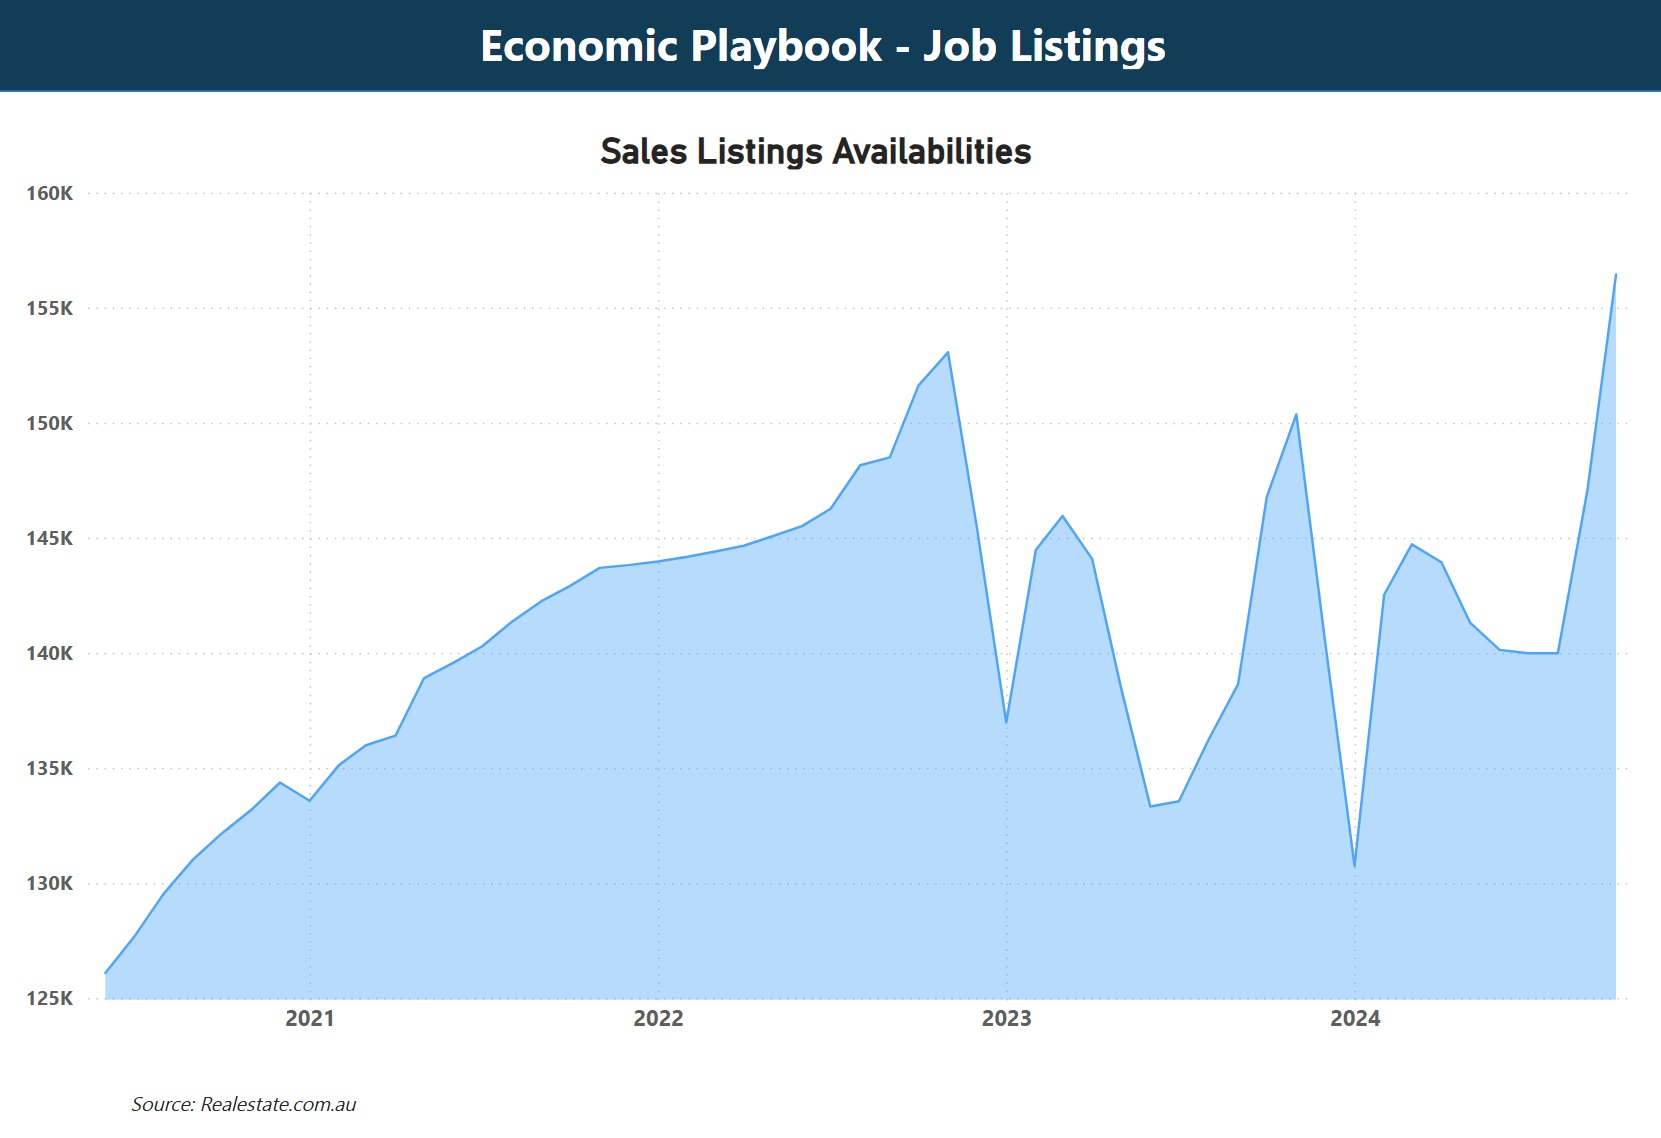
sales listings
While the rental market has tightened with a significant drop in listings, the sales segment has seen the opposite trend. Nationally, property sales listings have increased by 24%, from 126,000 in June 2020, to 156,000 in October 2024. This marks the highest level of listed properties since the pandemic began. This surge reflects varying market dynamics across states, highlighting contrasting pressures on rentals versus properties for sale.
In populous states like New South Wales and Victoria, sales listings have risen sharply, with NSW experiencing a 59% increase and Victoria following closely with a 57% jump. Higher interest rates and affordability pressures are likely motivating some owners to sell, while others will be tempted to cash in on significant gains accumulated over recent years.
In stark contrast, Western Australia saw sales listings drop by 33%, from 21,000 to 13,500, indicating different economic conditions. With WA’s strong economy and demand driven by mining and resources, housing supply remains limited.

outlook
With rental listings down and demand still high, renters are likely to face continued price pressure. However, the recent slowdown in immigration and reduced flow of international students may bring slight relief to the rental market in the near term.
In the housing market, Sydney saw a modest drop in prices last month, signalling a potential shift as supply begins to catch up with demand. This month the Reserve Bank of Australia (RBA) held its cash rate steady at 4.35%. The RBA’s decision reflects ongoing uncertainty regarding the timing of any rate cuts, with some now projecting that reductions may not occur until mid-2025 or until even later. This uncertainty continues to temper buyer confidence, potentially suppressing demand in the short term.
Overall, while renters may still face high costs due to limited supply, prospective homebuyers could benefit from greater choice and stable pricing in the coming months.
Also remember that our b2b and consumer tracking research runs monthly. Click here to find out more, and feel free to get in touch if you’ve got questions that you’d like to answer.
Posted in Uncategorized, Built Environment, QN, Social & Government, TL

